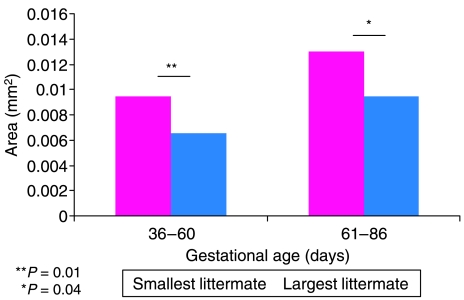
Fig. 2.
Fat area density per mm2 of muscle for grouped fetal samples aged 36–60 days of gestation and 61–86 days of gestation. The smallest littermate has an increased amount of fat present compared with the largest littermate in the group aged 36–60 days of gestation (P = 0.01) and in the group aged 61–86 days of gestation (P = 0.04).

