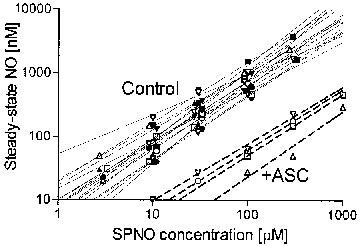
Figure 1.

Accumulation of NO from spermine/nitric oxide complex (SPNO). Steady-state NO was measured using a NO electrode as described in the Methods section. Assay solutions contained 3, 10, 30, 100, 300 or 1000 μM SPNO (for clarity, some data points are visually offset from the axis values). Three or four points define each line, which were fit by linear regression. Solid lines (Control) represent data where redox agents were absent from the assay solution. Dashed lines (+ASC) represent data obtained with 1 mM ascorbate in the assay solution.
