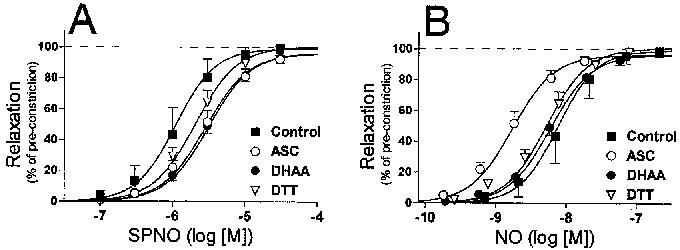
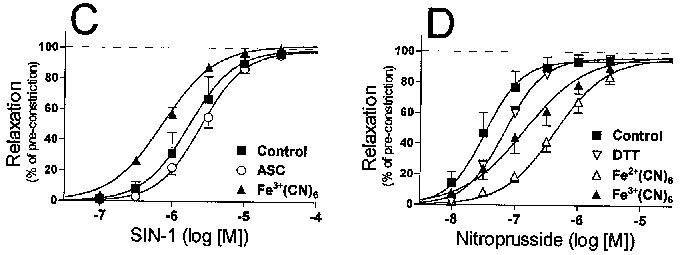
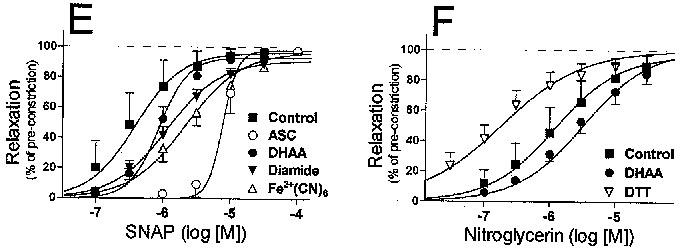
Figure 3.


Concentration–response profiles of nitrovasodilator-induced relaxations. Relaxations were calculated as the per cent reversal of the KCI-induced pre-constriction as determined in each individual experiment. Relaxations were induced by: (A) Spermine/nitric oxide complex (SPNO); (B) nitric oxide (NO, released from SPNO); (C) 3-morpholinosydnonimine (SIN-1); (D) nitroprusside; (E) S-nitroso-N-acetylpenicillamine (SNAP); or (F) nitroglycerin (NTG). Symbols denote the mean (±s.e.mean) relaxation at each concentration of nitrovasodilator. The equation of each curve is defined by the mean values of the maximal dilation, the Hill coefficient and the pEC50.
