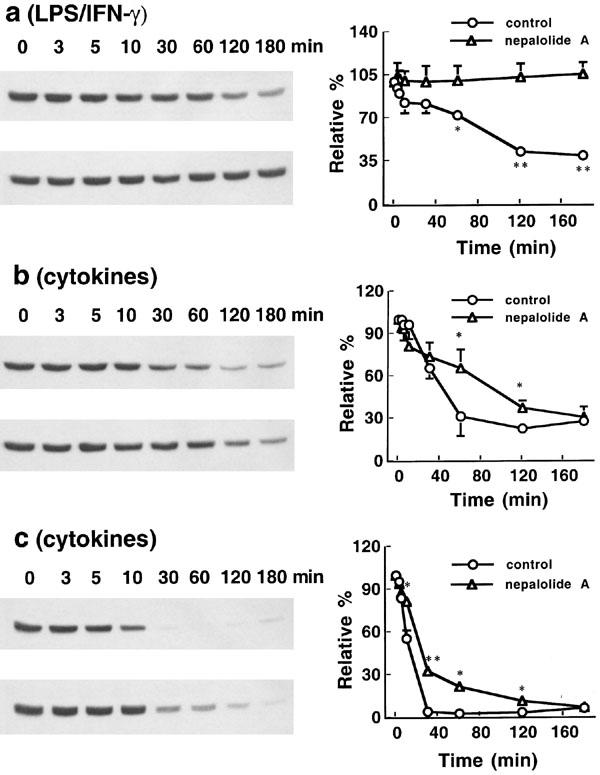
Figure 11.

Time-course effect of nepalolide A on the degradation of IκB-β. C6 glioma cells were treated with 5 μg ml−1 LPS/100 units ml−1 IFN-γ (a) or 5 ng ml−1 TNF-α/5 ng ml−1 IL-1β/100 units ml−1 IFN-γ (b) in the presence or absence of 10 μM nepalolide A for 0–3 h. Astrocytes were treated with 5 ng ml−1 TNF-α/5 ng ml−1 IL-1β/100 units ml−1 IFN-γ (c) plus or minus 10 μM nepalolide A for 0–3 h. After the incubation periods, cellular lysates were prepared and immunoblotting was performed. The left parts of (a, b and c) are representative immunoblots of intracellular IκB-β. The right parts are the relative levels of intracellular IκB-β in untreated cells or cells treated with nepalolide A. In each, the top left parts are cells treated with iNOS inducers in the absence of nepalolide A, the bottom left parts are cells treated with iNOS inducer in the presence of nepalolide A. Results are means±s.d. (where large enough to be shown) from three independent experiments, and expressed relative to the cells at zero time. Significant differences between control and nepalolide A-treated cells are indicated by * P<0.05; and **P<0.01.
