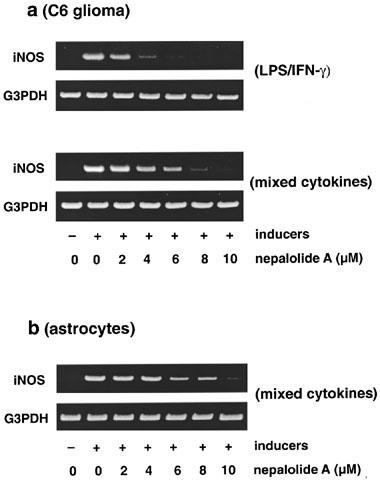
Figure 5.

RT–PCR analysis of the level of iNOS mRNA. C6 glioma cells (a) were treated with 5 μg ml−1 LPS/100 units ml−1 IFN-γ (LPS/IFN-γ) or 5 ng ml−1 TNF-α/5 ng ml−1 IL-1β/100 units ml−1 IFN-γ (mixed cytokines) in the presence or absence of various concentrations of nepalolide A for 5 h. For astrocytes (b), cells were treated with mixed cytokines plus or minus nepalolide A for 5 h. After incubation, total RNA was isolated and subjected to RT–PCR analysis. This experiment was repeated three times with similar results. G3PDH, glyceraldehyde-3-phosphate dehydrogenase.
