
Figure 1.
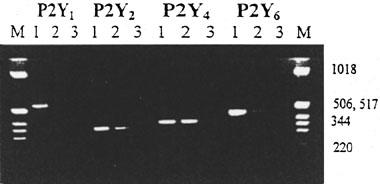
Agarose gel electrophoresis of RT–PCR amplification products from RBECs. Size markers (M) are 1 Kb ladder (Gibco BRL); approximate sizes are indicated. The receptors corresponding to the specific primers used in each amplification are indicated at the top. For each primer set lane 1 is a PCR from 5 ng of plasmid DNA containing the whole coding region of the appropriate P2Y receptor as a positive control, and lanes 2 and 3 used the RBEC cDNA as template in the presence (lane 2) and absence (lane 3) of reverse transcriptase respectively. The Figure is representative of three independent experiments on separate cell preparations.