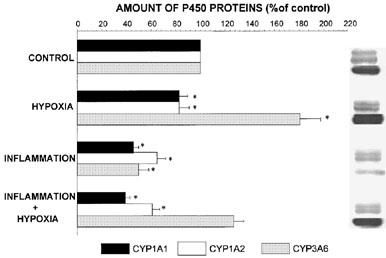
Figure 2.

Relative amounts and bands of hepatic CYP1A1, 1A2 and 3A6 immunoreactive proteins assessed by Western immunoblot analysis in control rabbits, rabbits subjected to hypoxia (PaO2≈35 mmHg) for 24 h, rabbits with a turpentine-induced inflammatory reaction, and rabbits with hypoxia and a turpentine-induced inflammatory reaction. Vertical bars are s.e.mean. *P<0.05 compared with control.
