
Figure 3.
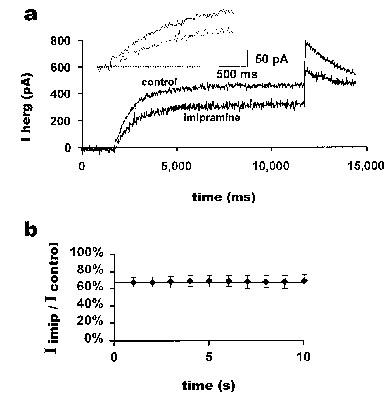
Imipramine inhibition during a long pulse. The currents from a 10 s pulse protocol applied to a typical cell before and after a 10 min application of 3 μM imipramine are shown in (a). The membrane potential was held at −80 mV, and HERG currents were evoked with a 10 s pulse to +20 mV. The cell was held at −80 mV for 10 min while imipramine was applied. The inset shows an expanded portion of the same record at the beginning of the pulse. From the above data, the ratio of current in the presence of imipramine to current before application of imipramine at successive 1 s time points is shown in (b). The horizontal line at the first value of 67% is provided to aid comparison of the data points (n=5).