
Figure 1.
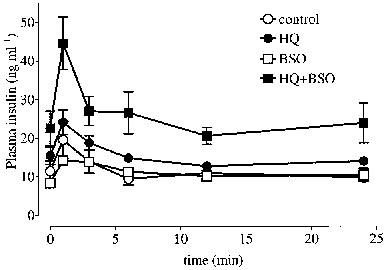
Plasma insulin curves following an i.v. glucose load (0.5 g kg−1) at t=0 min in 13-week-old obese Zucker rats (n=5–6) after 1 week, daily treatment with normal saline (control, 2 ml kg−1 i.p.), hydroquinone (HQ, 50 mg kg−1 i.p.), L-buthionine sulphoximine (BSO, 50 mg kg−1 i.p.) or HQ+BSO (each at 50 mg kg−1 i.p.). Values are mean±s.e.mean. See text for basal values of glucose and insulin.