
Figure 6.
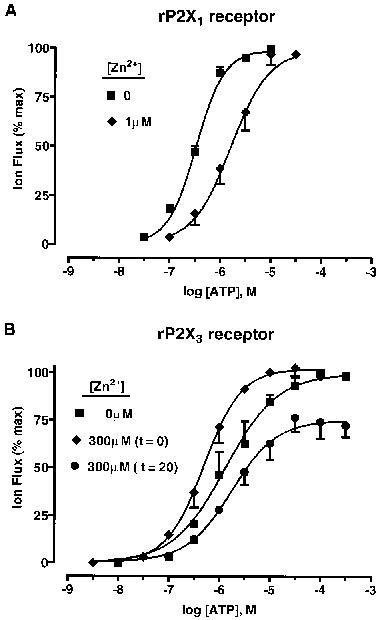
Zn2+ modulation of agonist potency and efficacy at P2X (Group 1) receptors. (A) concentration/response (C/R) curves for whole-cell inward currents to ATP (30 nM–30 μM) at rP2X1 receptors, in the absence and present of Zn2+ (1 μM), at pH 7.5. Zn2+ was applied for 20 min prior to each concentration of ATP. (B) C/R curves for whole-cell inward currents to ATP (3 nM–300 μM) at rP2X3 receptors, in the absence and presence of Zn2+ (300 μM) at pH 7.5. Zn2+ was applied either simultaneously with ATP (t=0) or 20 min prior to ATP (t=20). Data points are means±s.e.mean, n=4.