Figure 1.

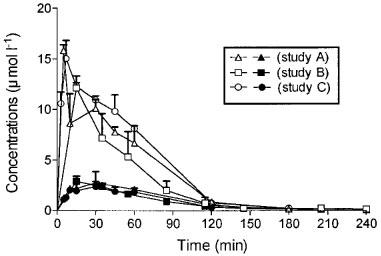
Time course of plasma concentrations of total M6G (10 mg kg−1 s.c., solid symbols) and total morphine (10 mg kg−1 s.c., open symbols) in rats. Values represent mean±s.d., n=5 (Anova, Bonferroni multiple comparison tests).

Time course of plasma concentrations of total M6G (10 mg kg−1 s.c., solid symbols) and total morphine (10 mg kg−1 s.c., open symbols) in rats. Values represent mean±s.d., n=5 (Anova, Bonferroni multiple comparison tests).