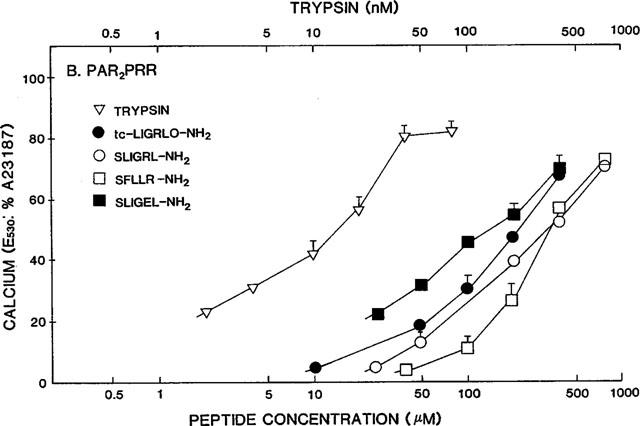
Figure 4.

Concentration effect curves for PAR-APs and trypsin in PAR2PRR cells. The fluorescence responses relative to the signal caused by 2 μM A23187 (E530: %A23187) were measured for increasing concentrations of the indicated PAR-APs and trypsin, exactly as described in the legend to Figure 3.
