
Figure 7.
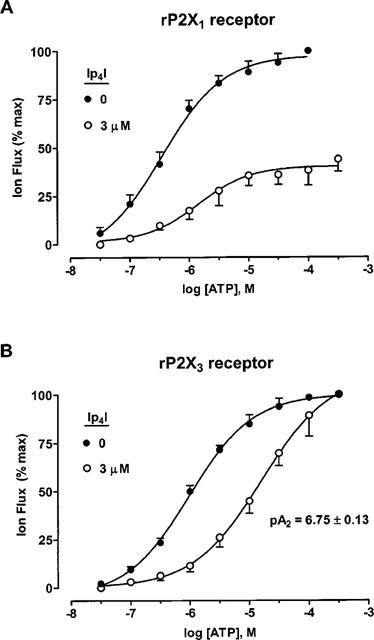
Ip4I antagonism of ATP-responses at Group 1 P2X receptors. (A) Concentration-response curves for ATP (0.03–300 μM) at homomeric rP2X1 receptors, before and during the presence of Ip4I (3 μM). (B) Concentration-response curves for ATP (0.03–300 μM) at homomeric rP2X3 receptors, before and during the presence of Ip4I (3 μM). EC50 values, Hill coefficients and pA2 values given in the text. Data: means±s.e.mean (n=4) for paired C/R curves, in A and B.