
Figure 5.
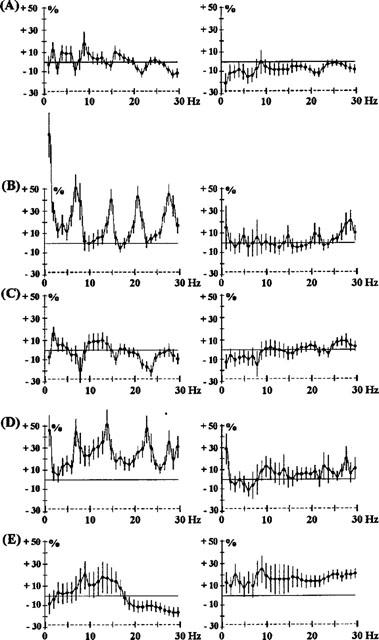
Effects of benzamides: amisulpride 1 mg kg−1 i.p. (A) and 15 mg kg−1 i.p. (B); metoclopramide 2.5 mg kg−1 i.p. (C); sulpiride 7.5 mg kg−1 i.p. (D) and 15 mg kg−1 i.p. (E). The ordinate represents the percentage change in EEG power. Vertical bars for each Hz show 95% confidence intervals. Panels on the left show data from prefrontal cortex, panels on the right show data from sensorimotor cortex.