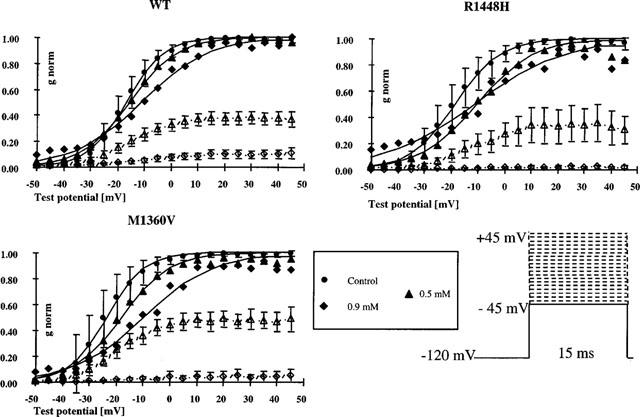
Figure 2.

Conductance transforms (mean±s.d.) of the peak current-voltage plots depicted in Figure 1 for two representative concentrations of 4-CmC [0.5 and 0.9 mM], normalized to control (empty symbols) or to the peak conductance in the presence of drug (filled symbols). 4-CmC shifted the midpoints of the curves in the direction of less negative membrane potentials and reduced the slope of the curves indicating that voltage-dependence of activation is slightly reduced in the presence of the drug and the relative amount of channels that open during a depolarization is reduced at a given test potential.
