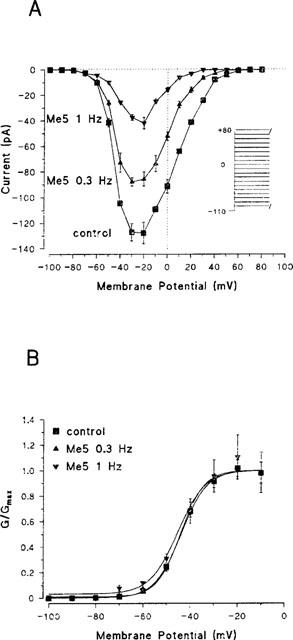
Figure 3.

Effect of Me5 on current–voltage relationship and activation curve of peak sodium currents in a cell-attached patch of rat skeletal muscle fibre. (A) Current–voltage relationships were constructed before (control, 1 Hz) and after application of 10 μM Me5 from protocol shown in inset. Same patch as in Figure 2. (B) Normalized activation curves were constructed from current–voltage relationships shown in (A) by converting current to conductance considering a reversal potential of +70 mV for sodium ions (see Methods). Data were fitted to the Boltzmann equation with the following parameters: Vx=−44.0 mV and K=5.5 mV for control; Vx=−44.1 mV and K=5.0 mV for Me5 at 0.3 Hz; Vx=−43.9 mV and K=6.8 mV for Me5 at 1 Hz.
