
Figure 2.
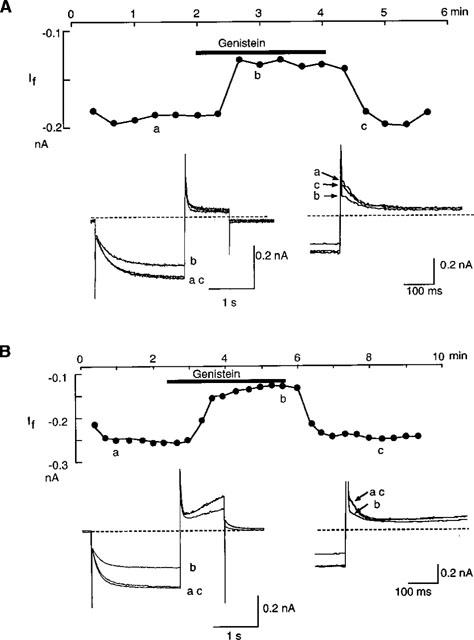
Inhibition by genistein of If. If was recorded by the ruptured (A) and nystatin-perforated patch clamp method (B). If was elicited by 2 s hyperpolarizing pulses from −40 mV to −120 mV every 20 s. Upper panels show changes of If amplitude during the genistein application. The bar above the graph indicates an application of 100 μM genistein. The current amplitude was measured as the time dependent inward current which was activated during the hyperpolarizing pulse. The lower left panels show superimposed original current traces obtained at the points indicated in the left graphs. The dotted line indicates the zero current level. In the lower right panels, tail currents are shown in an expanded time scale.