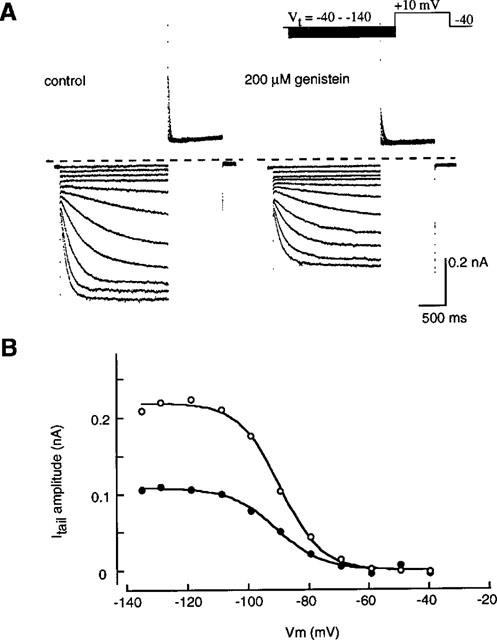
Figure 4.

Voltage-dependent activation of If. (A) The original current recordings obtained in the absence (left panel) and presence (right panel) of 200 μM genistein. The pulse protocol is shown in the upper part. (B) Relationships of voltage and activation of If obtained from (A). The tail current amplitude was normalized in reference to that of the maximal amplitude in the absence of genistein and plotted against the membrane potential. The smooth curves were drawn by the least squares fit with the Boltzmann equation,  the values of S and V1/2 were 6.8 mV and −89.4 mV in the control, and 7.8 mV and −90.5 mV in the presence of 200 μM genistein, respectively.
