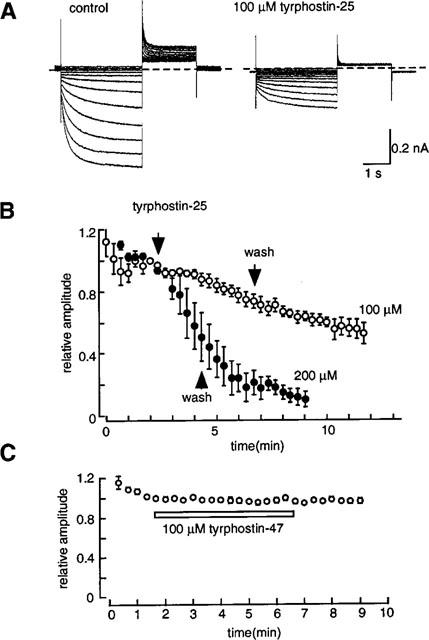
Figure 7.

Effects of tyrphostin-25 and tyrphostin-47 on If. (A) The current traces recorded before (left) and during the application of 100 μM tyrphostin-25. (B) The time course of If inhibition by 100 (open circles) and 200 μM (filled circles) tyrphostin-25. The pulse protocol was the same as shown in Figure 6. The If amplitude was normalized to that recorded just before application of genistein and plotted against the experimental time. The times of application and removal of the drug are indicated by arrows. Each symbol indicates mean±s.e.mean of four cells. (C) The time course of changes in If amplitude during the application of 100 μM tyrphostin-47. The horizontal bar indicates the duration of application of tyrphostin-47. Each symbol indicates mean±s.e.mean of four cells.
