
Figure 4.
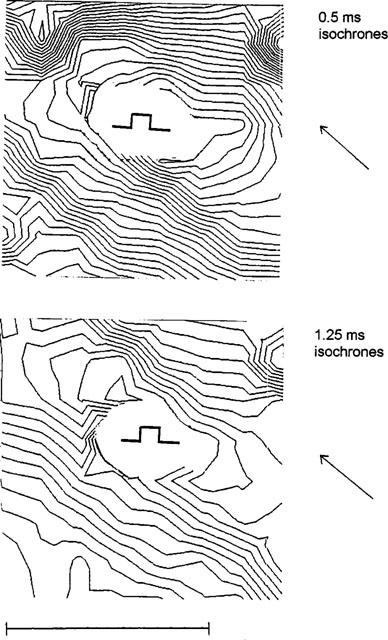
Influence of palmitoleic acid (10 μM) on the isochrone pattern of epicardial activation. The pattern shows the activation of the back wall (8 * 8 mm) with the site of pacing being indicated. The upper panel gives isochrones of the left ventricular wall under control conditions (0.5 ms isochrones), the lower panel after application of palmitoleic acid (10 μM) (1,25 ms isochrones). Note the change in the length to width ratio of the elliptic isochrones. The stimulation point is indicated. The horizontal bar represents 5 mm. The macroscopic fibre orientation in this area is indicated by the arrow.