
Figure 1.
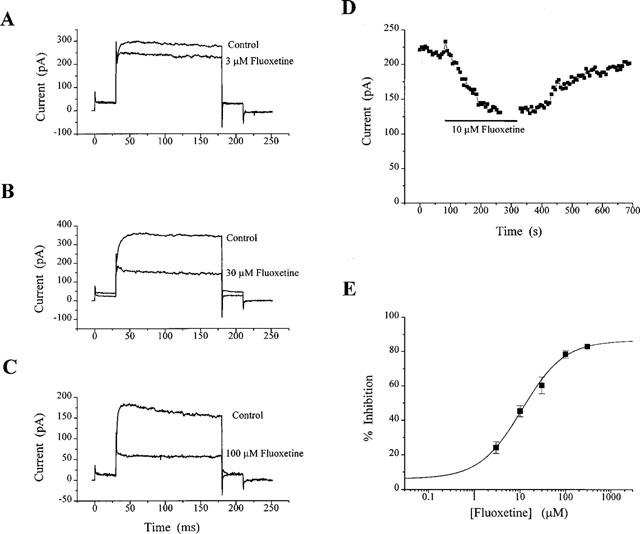
Concentration-dependent inhibition of KV currents in CGNs by fluoxetine. In the representative cells (A–C), 3, 30 and 100 μM fluoxetine produced 17, 59 and 63% inhibition respectively. Currents were activated by protocol 1 (see Methods). Each trace is the average current of four individual traces and all have been leak subtracted off-line. A time course plot in response to 10 μM fluoxetine is shown in (D). Each point is an average current taken over 15 ms, commencing 134 ms following the test step to +10 mV. The gap in the plot represents time during which an I-V relationship was obtained. The concentration-response curve for fluoxetine is shown in (E). Data points were fitted with a power function, giving a calculated IC50 value of 11 μM, with a slope of 0.94 and a maximal inhibition of 87%.