
Figure 1.
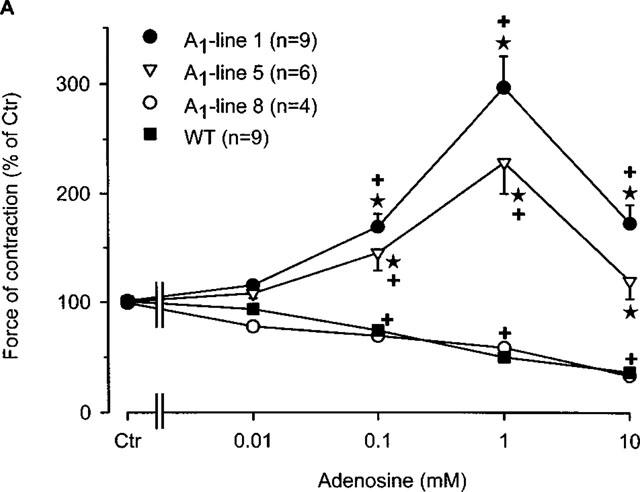
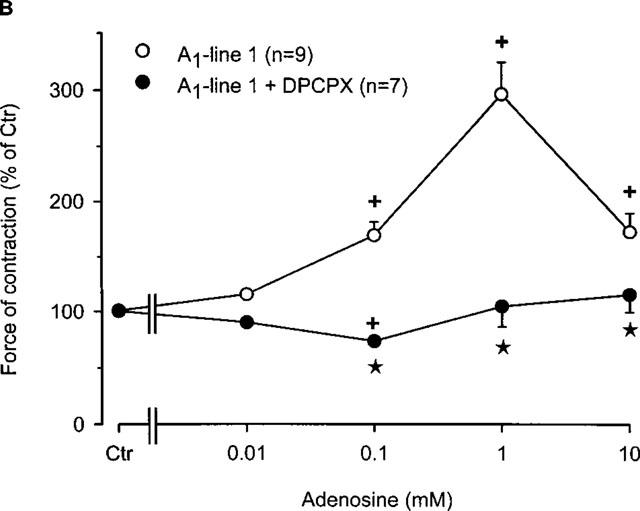
(A) Concentration response curve for the effect of adenosine on force of contraction in electrically driven left atria from wild-type mice and A1-adenosine receptor overexpressing mice. Adenosine was cumulatively applied to the organ bath. The transgenic lines exhibited increasing levels of receptor overexpression in the order of lines 8, 1 and 5. Numbers in brackets indicate the number of individual left atria. Asterisks indicate a significant difference between atrial groups, and crosses indicate a significant difference from Ctr. Differences between groups were significant using analysis of variances. (B) Concentration response curve for the effect of adenosine on force of contraction in electrically driven left atria from A1-adenosine receptor overexpressing mice (line 1) in the presence and absence of the A1 adenosine antagonist DPCPX (1 μM). Adenosine was cumulatively applied to the organ bath. Numbers in brackets indicate number of individual left atria. Asterisks indicate a significant difference between adenosine alone an in the presence of DPCPX, and crosses indicate a significant difference from Ctr. Differences between groups were significant using analysis of variances.