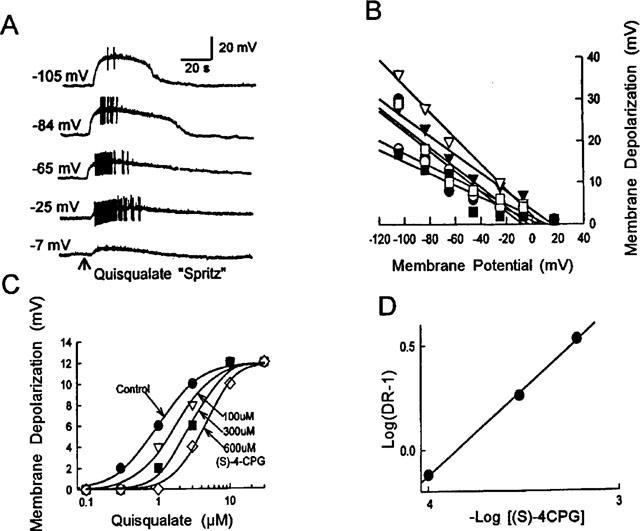
Figure 2.

Reversal potential and antagonism of QA-evoked membrane depolarization. (A) The amplitude of QA-induced depolarization increased when the neuron was hyperpolarized and decreased when it was depolarized. QA was applied by micropressure ejection (100 μM, 40 ms). Morphology of this neuron appears in Figure 3E. (B) Quantitative data for the relationship of QA-induced depolarization and membrane potential for 6 different neurons. (C) Concentration-response curves obtained in absence and presence of different concentrations of S-4-CPG in a submucosal neuron. (D) Schild plots derived from graphs in C had a pA2 of 3.85.
