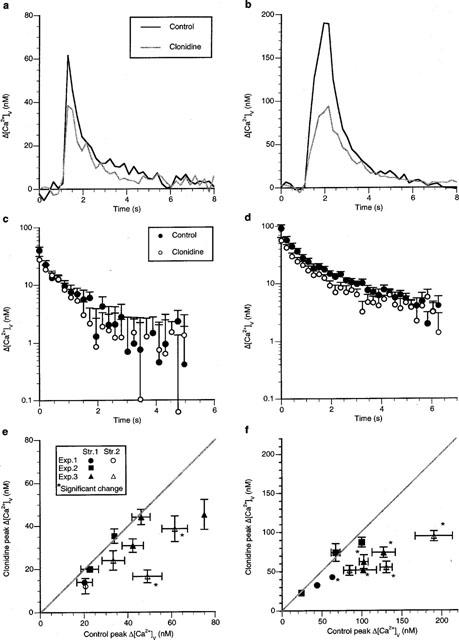
Figure 4.

Clonidine decreases Δ[Ca2+]v in some varicosities following an impulse but in a majority of varicosities during short trains of impulses without changing the rate of sequestration of Δ[Ca2+]v. (a and b) show the typical Δ[Ca2+]v response before, during and following a single impulse and a short train of five impulses at 5 Hz, respectively, during a class A response in a single varicosity in response to clonidine (1 μM). (c and d) show the average changes in Δ[Ca2+]v from eight varicosities on log-linear coordinates following the stimulation protocols given in (a) and (b) respectively; if a double exponential curve is fitted to these results then the following amplitudes and time constants are obtained (c) control amplitudes of 31±4 and 13±3 nM with time constants of 4.0±0.7 and 0.15±0.09 s respectively; clonidine amplitudes of 26±3 and 5±2 nM with time constants of 1.7±0.2 and 0.1±0.1 s respectively. (d) control amplitudes of 76±16 and 22±6 nM with time constants of 3.2±1.1 and 0.22±0.7 s respectively; clonidine amplitudes of 51±5 and 12±6 nM with time constants of 1.7±0.4 and 0.02±0.08 s respectively). (e) gives the average peak Δ[Ca2+]v due to a single impulse in the presence of clonidine plotted against that in the control solution. (f) gives the average peak Δ[Ca2+]v amplitude due to a short train of impulses (five impulses at 5 Hz) in the presence of clonidine plotted against that for the same varicosity in control solution.
