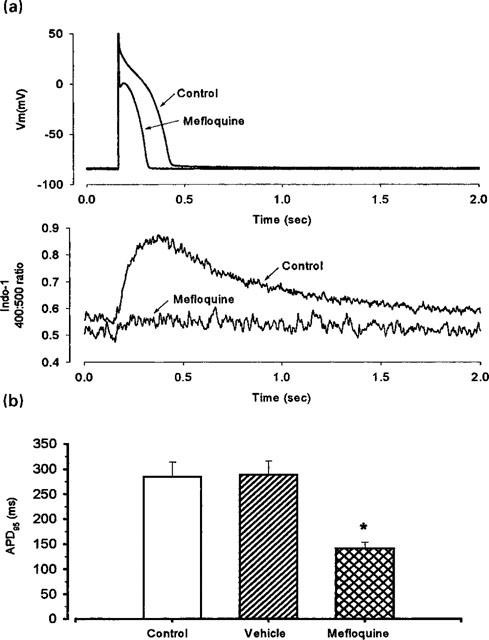
Figure 8.

Effects of 10 μM mefloquine on the action potential and on the Ca2+ transient. (a) Typical records of action potential (upper traces) and Ca2+ transient (lower traces) during control conditions and after superfusion with 10 μM mefloquine. (b) Mean data from eight cells (from left to right as specified for each bar) showing APD95 under control conditions, during superfusion with vehicle (0.1 % propylene glycol) and with 10 μM mefloquine. Vertical bars indicate s.e.mean. *P<0.05, compared with control, paired t-test.
