
Figure 4.
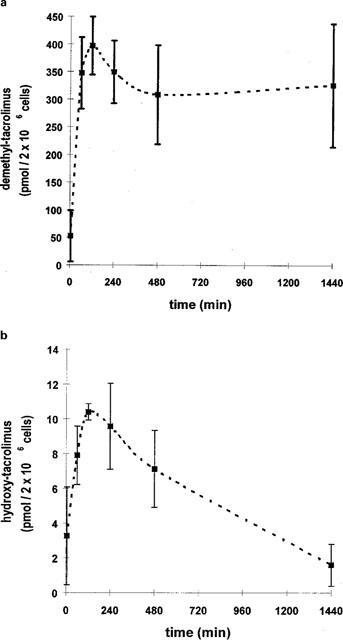
Kinetics of tacrolimus metabolite formation in intestinal enterocytes exposed to 3, 7 μmol l−1 tacrolimus for 0, 1, 2, 4 or 24 h. Tacrolimus was added to the cell cultures 4 h following isolation. Metabolites were analyzed by LC/particle beam-MS. Data is shown as mean±s.d. of at least three dishes (2×10⁶ cells). (a) demethyl-tacrolimus (M1); (b) bisdemethyl-tacrolimus (M2), demethyl-hydroxy-tacrolimus (M3) and hydroxy-tacrolimus (M4).