
Figure 3.
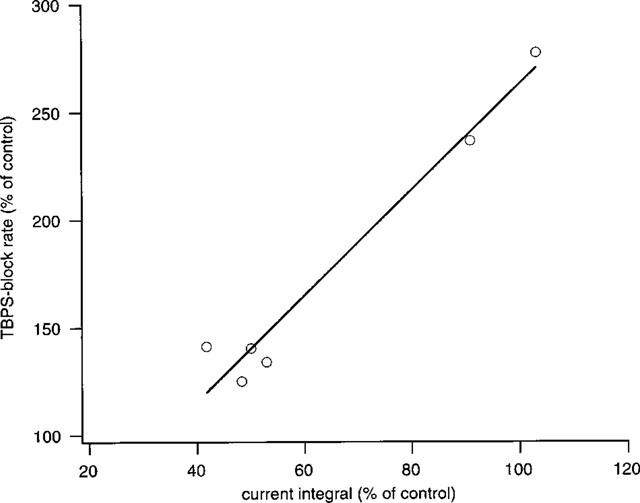
Summary of results of six experiments with penicillin and TBPS. The graph shows relative change in block rate plotted against the change in current integral (i.e. total channel open time) produced by penicillin (5 or 10 mM). Note that all values for change in block rate are >100%, indicating that penicillin invariably produced an enhancement of block. However, this graph suggests a negative correlation (solid line, correlation coefficient: 0.93) with the total reduction in charge transfer produced by penicillin (see text).