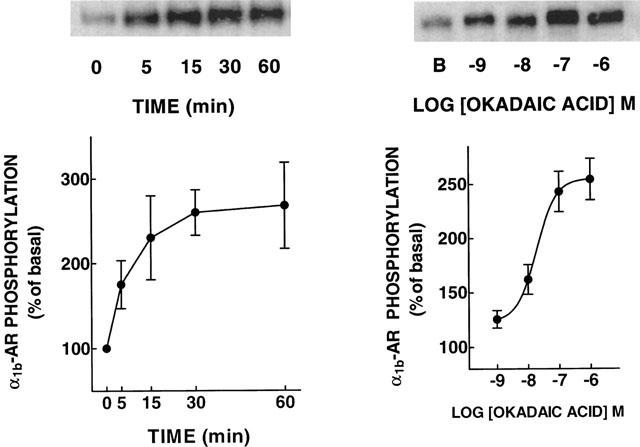
Figure 1.

Effects of okadaic acid on α1b-adrenoceptor phosphorylation. Left panel: cells were incubated with 1 μM okadaic acid for the times indicated. Right panel: cells were incubated with the indicated concentrations of okadaic acid for 30 min. Plotted are the means and vertical lines represent the s.e.mean of three determinations using different cell preparations. Representative autoradiographs are shown. B, basal phosphorypatium.
