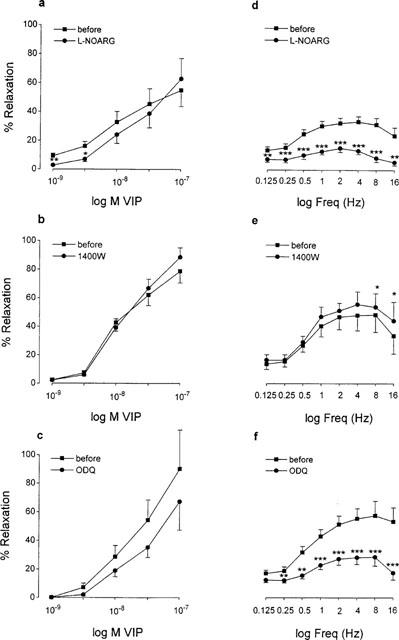
Figure 5.

Concentration-response curves to VIP (a–c) and frequency-response curves to EFS (40 V, 0.1 ms, 0.125–16 Hz) with 10 s trains (d–f) in circular smooth muscle strips of the guinea-pig gastric fundus in the absence and presence of L-NOARG (10−4 M, a, d), 1400 W (10−6 M, b, e) and ODQ (10−6 M, c, f). Values are mean±s.e.mean from n=6, *P<0.05, **P<0.01, ***P<0.001, significantly different from the response before the addition of L-NOARG, 1400 W or ODQ.
