Figure 6.

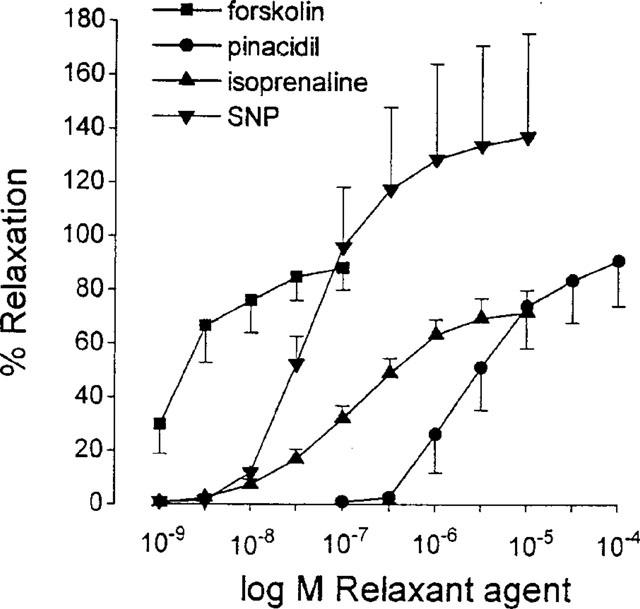
Concentration-response curve to forskolin (10−9–10−7 M), pinacidil (10−7–10−4 M), isoprenaline (10−9–10−5 M) and SNP (10−9–10−5 M) in isolated smooth muscle strips of guinea-pig gastric fundus. Values are mean±s.e.mean from n=6.

Concentration-response curve to forskolin (10−9–10−7 M), pinacidil (10−7–10−4 M), isoprenaline (10−9–10−5 M) and SNP (10−9–10−5 M) in isolated smooth muscle strips of guinea-pig gastric fundus. Values are mean±s.e.mean from n=6.