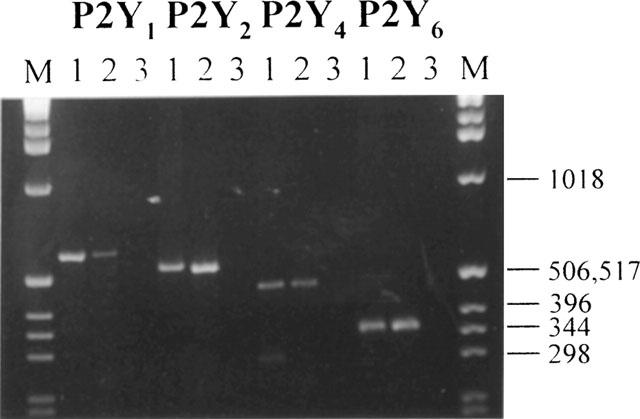
Figure 1.

RT–PCR analysis of P2Y receptor transcripts present in primary rat hepatocytes. Agarose gel electrophoresis of PCR products, see Methods for further details. (M), size markers: 1 Kbp ladder, appropriate sizes are indicated. For each receptor amplification lane 1 is a PCR reaction using the appropriate plasmid construct as template, lanes 2 and 3 incorporate cDNA syntheses where reverse transcriptase was present or absent respectively. The figure is representative of three independent experiments.
