
Figure 4.
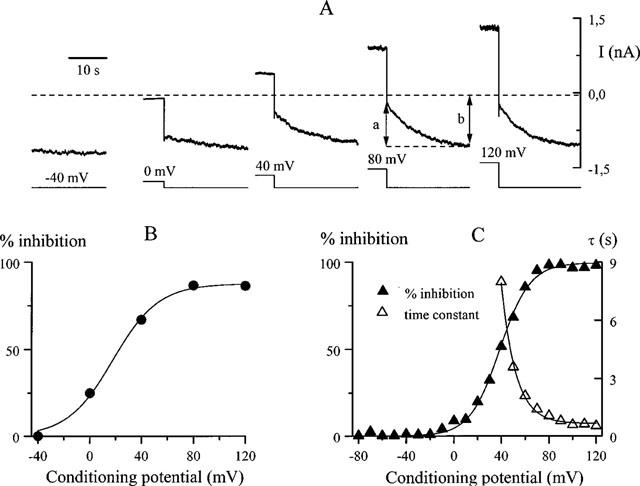
Voltage dependence and kinetics of the inhibition at fixed SK&F 96365 concentration. (A) cationic current evoked by 50 μM carbachol at −40 mV in control (left) and following 20 s duration voltage steps to different test potentials (note that only the last 5 s segment is shown for each trace during the test pulse). All traces were recorded in the presence of 10 μM SK&F 96365. Dotted line indicates background current amplitude at −40 mV before agonist application. (B) per cent of depolarization-induced inhibition of the cationic current plotted against test potential for the data shown in A. The values were calculated as a/b×100% with a and b measured as shown in A. Data points were fitted by a Boltzmann distribution with the potential of half-maximal inhibition of 18 mV and slope factor of −18 mV. (C) per cent inhibition of the cationic current evoked by intracellular 200 μM GTPγS application (no carbachol in the bath) depending on test potential in the presence of 30 μM SK&F 96365. Voltage protocol was similar to that illustrated in A. Best-fit values for the potential of half-maximal inhibition and slope factor were +38 mV and −13 mV, respectively. In the same cell the time constant of the inhibition during test depolarization decreased e-fold per 11.9 mV.