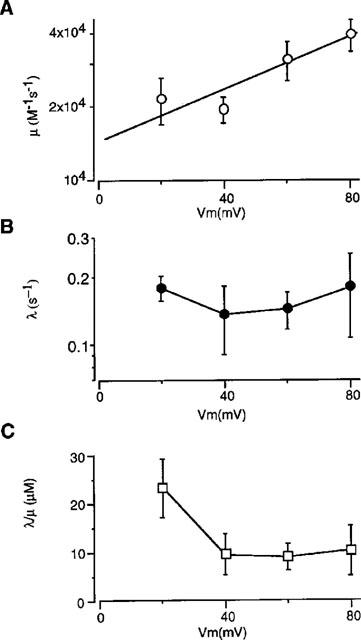
Figure 6.

Voltage dependency of the blocking and unblocking rates of 293B. (A) The relationship between the blocking rate (μ) and the membrane potential. The line indicates the least squares fit with a slope of an e-fold increase per 80.9 mV. (B) The relationship between the unblocking rate (λ) and the membrane potential. (C) The relationship between the dissociation constant (λ/μ) and the membrane potential.
