
Figure 1.
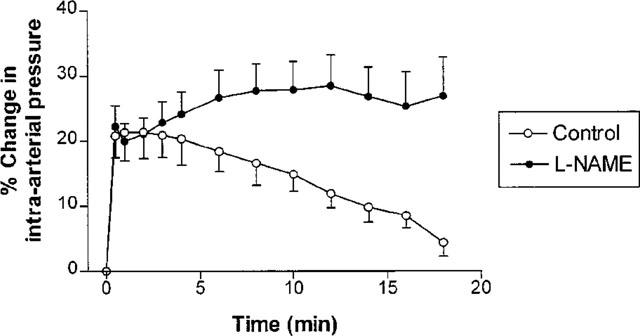
Percentage changes in rabbit femoral artery pressure (mean±s.e.mean) from baseline, as a function of time following an abrupt increase in perfusion rate to 140% of baseline (n=7). Pressure responses are shown before and after treatment with 1 μmol kg−1 L-NAME. The initial rise in pressure was the same in the absence or presence of L-NAME; however, L-NAME abolished the subsequent slow decline in pressure (P<0.0001).