
Figure 7.
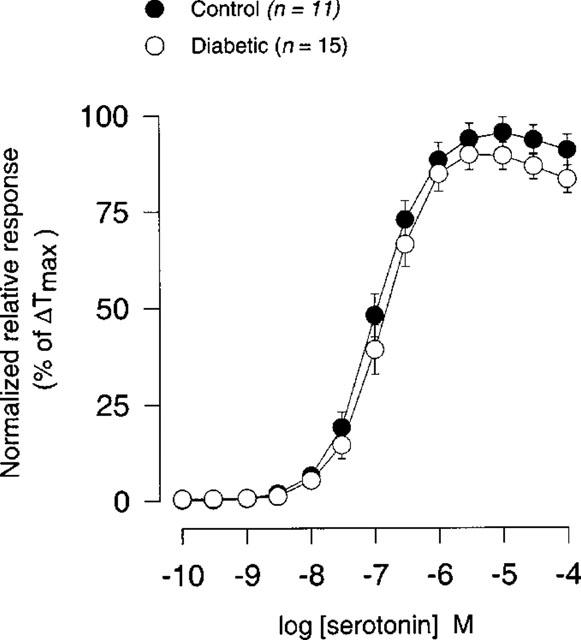
Concentration-response curves for serotonin (0.1 nM–100 μM) in coronary arteries from STZ-induced diabetic Wistar rats (n=15) and age-matched controls (n=11). Points represent mean values and vertical bars indicate±s.e.mean where this value exceeds the size of symbol. Normalized relative responses are given as percentage fraction of ΔTmax.