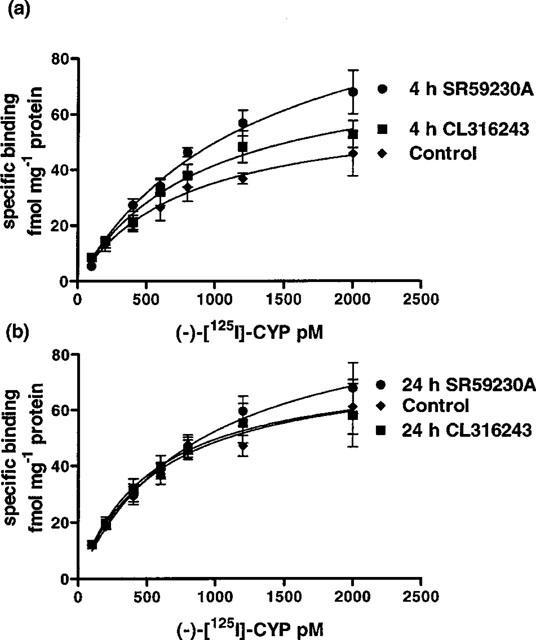
Figure 4.

Saturation binding curve of (−)-[125I]-CYP to mouse ileal membrane preparations. Graphs show specific binding; (a) shows the significant increase in (−)-[125I]-CYP binding following SR59230A (4 h) (2-way ANOVA ***P<0.0001) and CL316243 (4 h) treatment (2-way ANOVA *P<0.05); (b) shows that 24 h SR59230A or CL316243 treatment had no significant effect on (−)-[125I]-CYP binding (2-way ANOVA ns). Points show mean±s.e.mean (n=5–6).
