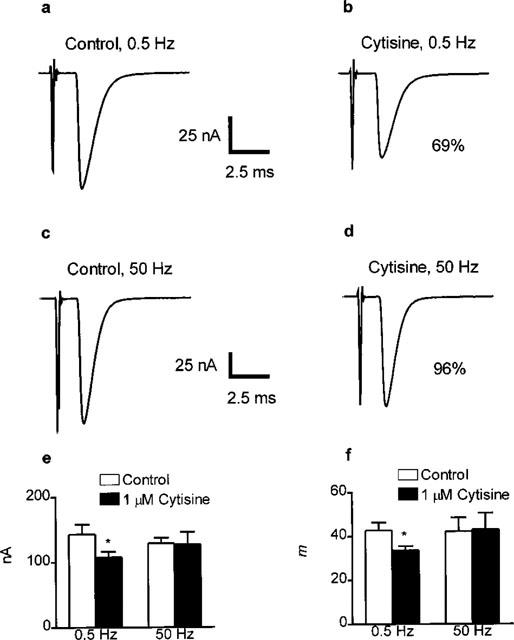
Figure 2.

Examples of the effects of 1 μM cytisine on representative epcs at 0.5 Hz (a,b) or 50 Hz (c,d) and on average epc amplitude (e) and epc quantal content (f) recorded from rat isolated hemidia-phragm muscle fibres. Each trace in a–d is an average of approximately 80 individual epc recorded before (a,c) or after (b,d) the application of 1 μM cytisine to the muscle fibre. In each case the control and drug-treated epcs were recorded from the same muscle fibre. For all records, holding potential was −50 mV and [Ca2+] was 1.8 mM. Annotated values are the amplitude of the epcs in cytisine (b,d) expressed as a percentage of their respective control (a,c). Calibration bars for all traces: vertical 25 nA; horizontal, 2.5 nA. Panels e and f show bar chart of the average effects of 1 μM cytisine on epc amplitude and epc quantal content respectively. Data are mean and s.e.mean of values from ten (0.5 Hz) or eight (50 Hz) individual determinations. Asterisks indicate significant differences (P<0.05 two-tailed paired Student's t-test, cytisine versus control). Note that at 50 Hz, 1 μM cytisine affects neither epc amplitude nor m. Conversely, at 0.5 Hz, both parameters are reduced by around 20% by this concentration of cytisine.
