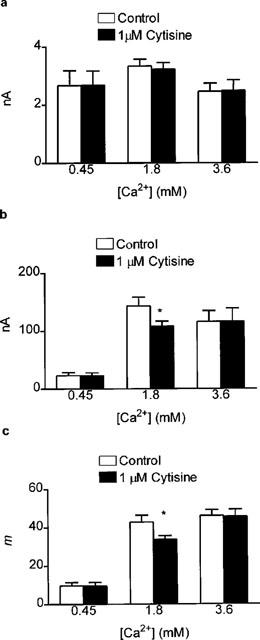
Figure 3.

Bar graph showing the effects of 1 μM cytisine on mepc amplitude (a), epc amplitude (b) and epc quantal content (c) in the rat isolated hemidiaphragm muscle. Epcs were recorded at 0.5 Hz and three different [Ca2+]o were used as indicated in the figure. Data for 1.8 mM [Ca2+]o are the same as in Figure 2 and are included for comparison. Note that 1 μM cytisine had no effect on mepc amplitude, irrespective of the [Ca2+]o. However, 1 μM cytisine reduced epc amplitude (and hence m) only when the [Ca2+]o was 1.8 mM. All data are mean and s.e.mean of 6–10 individual determinations. Asterisks indicate significant differences (P<0.05, two-tailed Student's t-test, cytisine versus control).
