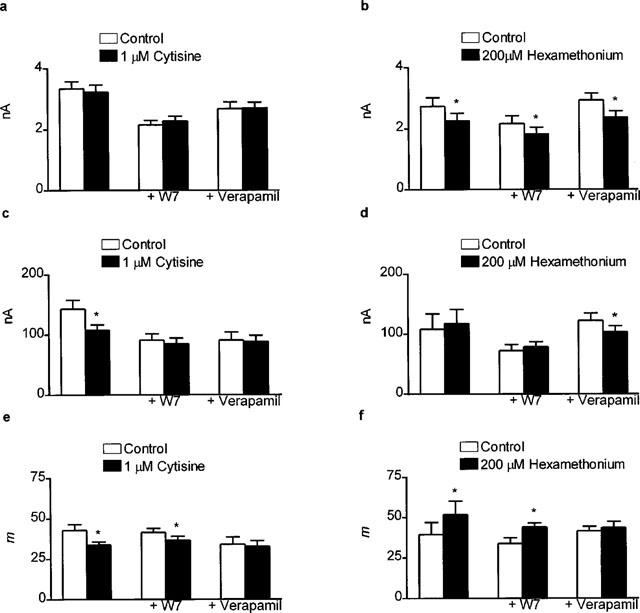
Figure 5.

Bar graph showing the effects of 1 μM cytisine (a,c,e) and 200 μM hexamethonium (b,d,f) on the amplitude of mepcs (a,b), the amplitude of epcs (c,d) and the epc quantal content (e,f) at 0.5 Hz in the rat isolated hemidiaphragm preparation in the absence and presence of W-7 or verapamil (both 10 μM). [Ca2+]o was 1.8 mM in all experiments. Data for cytisine alone are the same as in Figure 3 and are included for comparison. Data are mean and s.e.mean of values from 7–10 individual determinations. Asterisks indicate a significant effect of cytisine or hexamethonium on mepc amplitude, epc amplitude or epc quantal content (P<0.05, two-tailed paired Student's t-test, control versus cytisine or hexamethonium). Note that the effects of cytisine and hexamethonium on m were unaffected by the presence of W-7. However, in the presence of verapamil, both effects were abolished.
