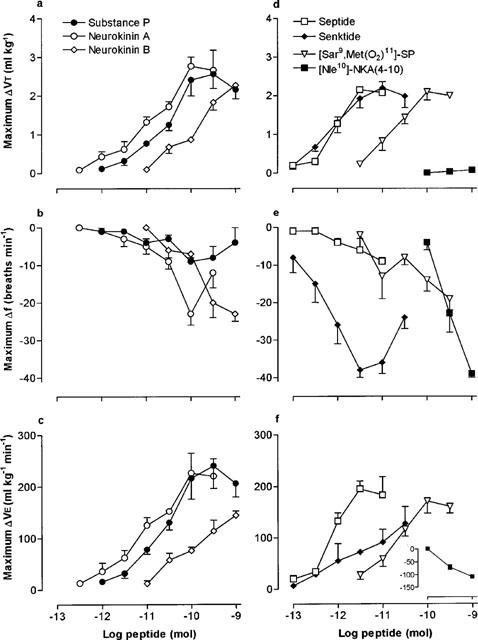
Figure 2.

Log dose-response curves for naturally-occurring tachykinins (a–c) and receptor-selective synthetic agonists (d–f), microinjected into the cNTS of spontaneously breathing, urethane-anaesthetized rats. Each point is the mean maximum agonist-induced change in tidal volume (ΔVT), frequency (Δf) or minute ventilation (ΔVE) of 3–8 rats. Vertical lines show the s.e.mean. Where error bars are not obvious, they are within the symbol.
