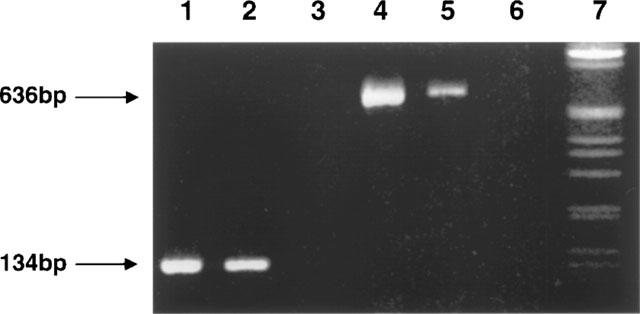
Figure 1.

Representative RT–PCR analysis of total cellular RNA isolated from HEK-293 cells transfected with SUR1 and Kir6.2 subunits. RT–PCR products were analysed on a 1% tris-borate-EDTA agarose gel and visualized by ethidium bromide. Lanes 1 and 4, SUR1 and Kir6.2 PCR products amplified from hSUR1 and Kir6.2 templates, respectively; lanes 2 and 5, SUR1 and Kir6.2 PCR products amplified from SUR1/Kir6.2 transfected HEK 293 cells, respectively; lanes 3 and 6 no reverse transcriptase controls for SUR1 and Kir6.2 from transfected HEK 293 cells, respectively; and lane 7, 1 kb DNA ladder. The expected fragment sizes corresponding to Kir6.2 (636 bp) and SUR1 (134 bp) are indicated by arrows.
