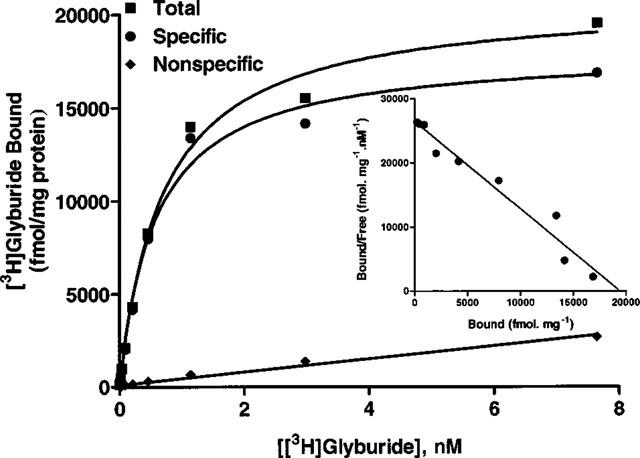
Figure 2.

Radioligand binding properties of HEK-293 cells expressing SUR1 and Kir6.2 subunits. Saturation analysis of specific [3H]-glyburide binding data to transfected cell membranes. Inset: Scatchard representation of specific binding data. Shown is a representative plot. The mean Bmax and KD values are summarized in Results.
