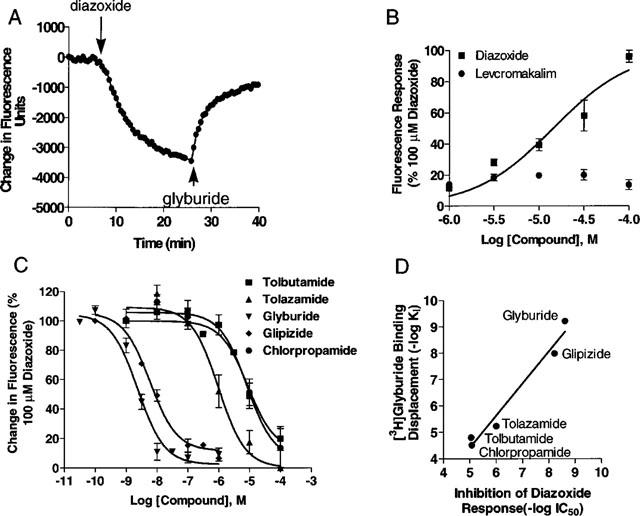
Figure 7.

Pharmacology of membrane potential responses in SUR1-Kir6.2 transfected HEK-293 cells assessed by the bisoxanol dye, DiBAC4(3). (A) Representative experiment showing typical changes in DiBAC4(3) fluorescence upon addition (indicated by down arrows) of diazoxide (100 μM) and its attenuation (indicated by up arrows) by the addition of glyburide (5 μM). Experiments were carried out in the presence of 10 mM 2-deoxyglucose and 0.1 μg ml−1 oligomycin as described in Methods. Diazoxide-evoked fluorescence changes were derived by subtracting responses from control cells treated with metabolic inhibitors alone. (B) Concentration response curves for fluorescence changes evoked by diazoxide and levcromakalim in transfected cells. Data is normalized to the response evoked by 100 μM diazoxide. (C) Concentration response for the inhibition of 100 μM diazoxide-evoked responses by glyburide (IC50=1.6±0.4 nM), glipizide (5.6±1.0 nM), chlorpropamide (20.3±8.0 μM), tolazamide (4.2±1.0 μM) and tolbutamide (12.5±5.3 μM). Depicted are mean±s.e.mean of 3–6 separate determinations. (D) Correlation of IC50 values for inhibition of diazoxide-evoked functional responses and the Ki values for displacement of [3H]-glyburide binding in transfected cells (r2=0.96; slope=1.21±0.12).
