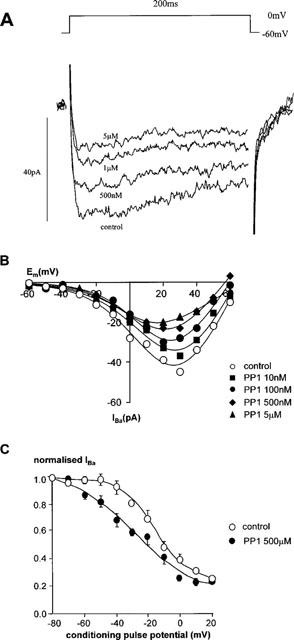
Figure 4.

Effect of PP1 on calcium channel currents. (A) The current traces evoked from a holding potential of −60 mV depolarizing to a test potential of 0 mV for 200 ms in a single rabbit ear artery cell. (B) The I-V relationship of calcium channel currents in a single rabbit ear artery cell. I-V relationships were derived as described in the legend for Figure 1. I-V data were measured at least 3–4 min after establishment of whole cell mode when the size of the currents had stabilized. Data are representative of three similar observations. (C) Steady-state inactivation of calcium channels. Steady-state inactivation curves were derived by using a double pulse protocol as described in the legend for Figure 1. IBa normalized with respect to IBa evoked by a −80 mV conditioning potential is plotted against the conditioning potential. Data are means±s.e.means of three separate experiments.
