
Figure 2.
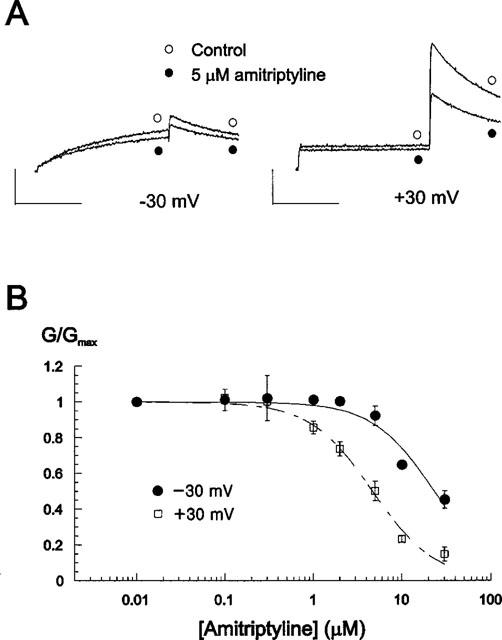
Voltage dependence of amitriptyline block on HERG current. (A) Current traces from a cell depolarized to −30 (left panel) and +30 mV (right panel) from the holding potential of −70 mV, before and after exposure to 5 μM amitriptyline. Tail currents were recorded at −60 mV. Magnitude of the decrease of the tail currents indicates that the block effect is larger at +30 mV. Calibration bars are 0.2 μA in height and 2 s in length. (B) Concentration-dependence of amitriptyline block at different membrane potentials. Conductance (G) in the presence of various concentration of amitriptyline was normalized to the maximum conductance (Gmax) obtained in control, and plotted against amitriptyline concentrations. Data were from Figure 1C. Symbols with error bars represent mean±s.e.mean: each data obtained from seven cells. Lines are the fits of data to the Hill equation, giving IC50 values of 23.0±3.24, 4.66±0.36 μM and Hill coefficients of 1.25±0.21, 1.23±0.11 at −30 and +30 mV, respectively.