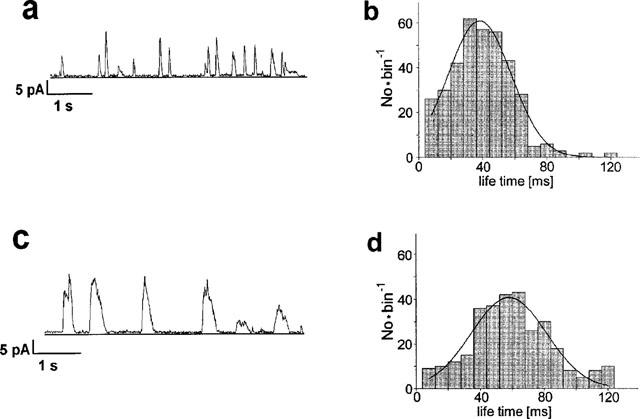
Figure 4.

Modulation of STOCs by 20 μM FK506. Left: Original traces showing STOCs before (a) and 2–5 min after addition of FK506 (c). Right: Life time histograms, the fitting Gaussian curves peaked at a life time of 35 ms before (b) and of 54 ms after addition of FK506 (d).
