
Figure 3.
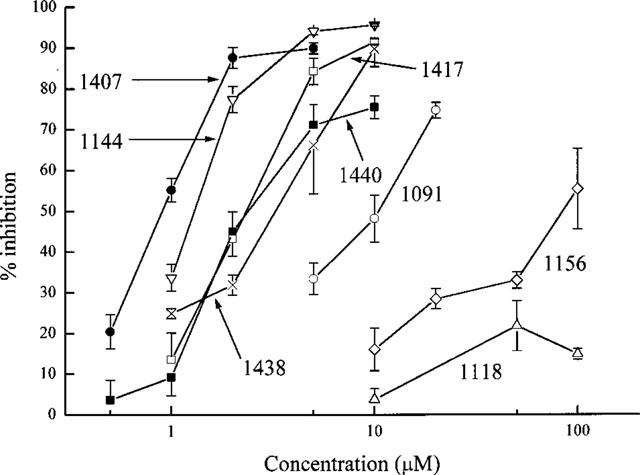
The relationship between the concentration of the compounds tested and inhibition of K+ loss from a suspension of rabbit red cells exposed to the Ca2+ ionophore A23187. The ionophore was applied 3 min after the drug was added to the cell suspension. Each point is the mean of 3–5 observations and the error bars show the s.e.means. The UCL prefixes of the compound identifiers have been omitted for clarity.