
Figure 2.
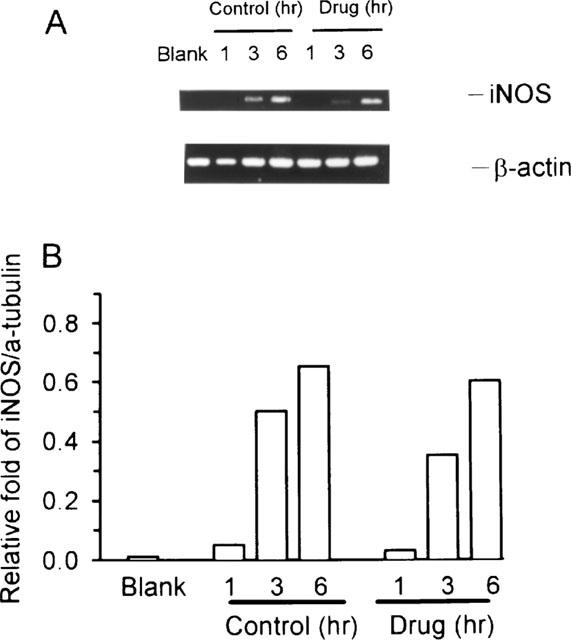
RT–PCR analysis of iNOS mRNA expression. (A) RAW 264.7 macrophages were incubated in the presence LPS (1 μg ml−1) plus IFN-γ (50 U ml−1) with or without andrographolide (50 μM) for 1, 3, and 6 h, respectively. (B) Band intensities were quantified by densitometer. This experiment was repeated three times with similar results.