
Figure 5.
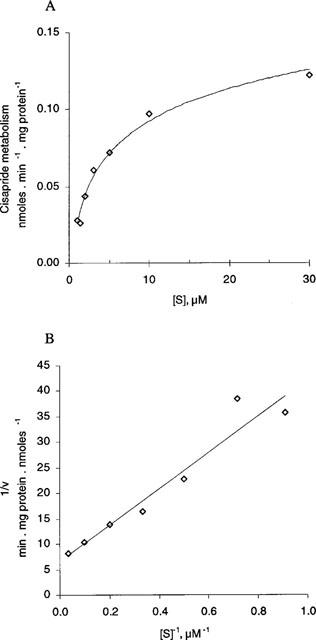
Michaelis-Menten (Figure 5A) and Lineweaver-Burke (Figure 5B) plot for the overall metabolism rate of cisapride in human liver microsomes. Incubations were carried out as described in the Methods section, with the exception of 14C-cisapride concentration which varied between 1.1–30 μM and the incubations which were terminated after 30 min. A representative graph using one batch of human liver microsomes is shown in this figure. Similar results were obtained with a further two batches of human liver microsomes.