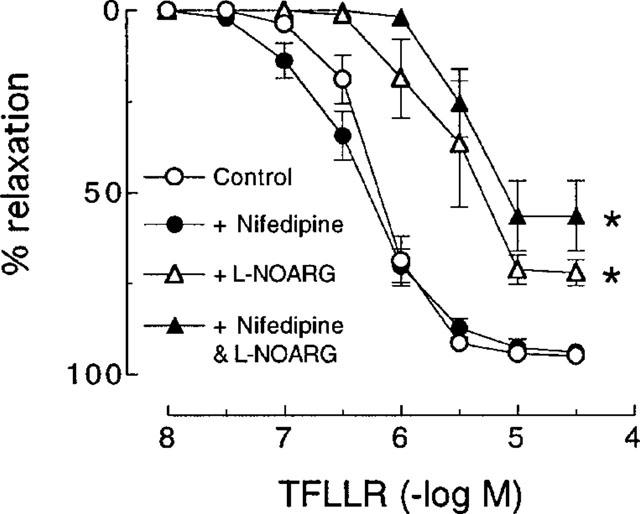
Figure 5.

Cumulative concentration-response curves to TFLLR in pig coronary artery ring preparations contracted to ∼50% of their maximum contraction with U46619 in the absence (control) and presence of nifedipine (0.3 μM), L-NOARG (100 μM) and a combination of nifedipine and L-NOARG. Each point represents the mean±s.e.mean of five experiments. *Denotes Rmax and pEC50 values significantly different from control (P<0.05).
